The rapid escalation of the current NYC blizzard from a forecasted 1-3 inches to a massive 24-inch event in under 72 hours exposes a systemic failure in predictive agility. This isn’t just a weather miss; it is a “flash-intensification” phenomenon that traditional meteorological models are struggling to capture. When a system jumps from a minor nuisance to a regional paralysis in three days, the primary casualty isn’t just the commute—it’s the reliability of the city’s entire emergency management framework.
Mapping the Accumulation: A Data-Driven Look at Snow Totals
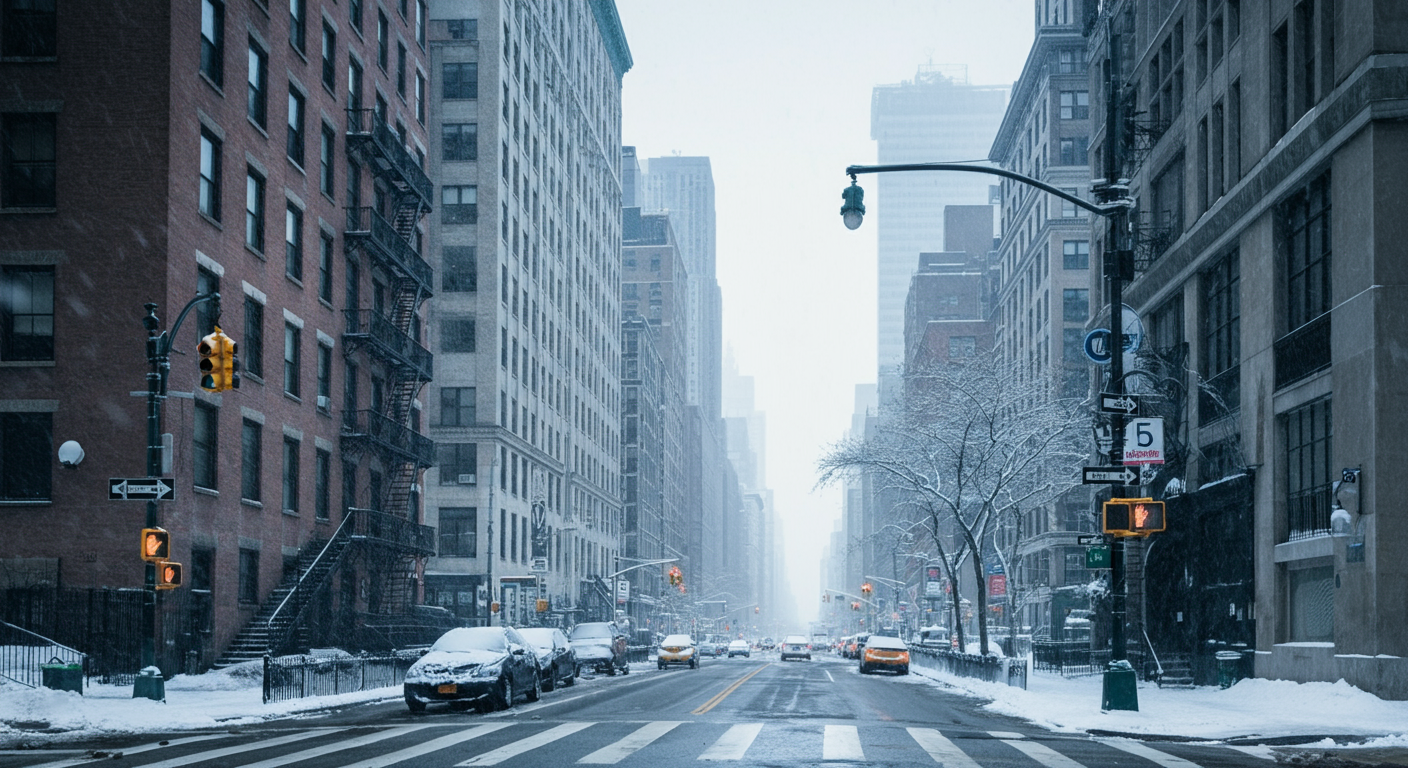
The snowfall distribution across the Tri-State area reveals a stark geographic volatility. While initial forecasts suggested a manageable dusting, additional snow accumulations of 17–24 inches are now being recorded in southern portions of the region. This disparity—where the urban core might see 5 inches while suburbs are buried under two feet—creates a logistical nightmare for resource allocation. The shift from a 1-to-3-inch expectation to a full-scale blizzard highlights a dangerous trend: the “normalization of the extreme,” where baseline predictions are consistently decimated by actual outcomes.
Systemic Paralysis: Evaluating the Impact on Critical Transit Hubs
Infrastructure in the Northeast is designed for steady snow, not 60 mph gusts and rapid-onset accumulation. The blizzard conditions have effectively neutralized the region’s “Golden Triangle” of aviation (JFK, LGA, EWR). When states of emergency are declared, the goal isn’t just public safety; it’s a desperate attempt to keep the roads clear for emergency vehicles by legally mandating a halt to private transit. The systemic paralysis occurs because the labor force required to maintain rail and road integrity cannot reach their posts, creating a feedback loop of immobility.
The Economic Cost of a Standstill: Disruption to the Urban Core
For a service-based economy like New York’s, a physical standstill is a fiscal hemorrhage. The “Urban Core” relies on high-velocity foot traffic and just-in-time logistics. When the most severe snowstorm in recent years hits, the immediate financial loss is felt in the collapse of the “last-mile” delivery economy and the total cessation of the hospitality sector. This isn’t a one-day loss; it’s a multi-day recovery period where the overhead costs of heating and clearing property far outweigh the zeroed-out revenue.
Resilience Assessment: Benchmarking NYC’s Response
NYC’s response is currently being measured against the “Snowgate” incidents of the past. The preemptive declaration of emergencies suggests that political leaders now prioritize over-correction. By treating a 5-inch forecast with the gravity of a 20-inch storm, they mitigate political risk but increase “warning fatigue” among the populace. The resilience of the city is no longer just about plows; it’s about the digital infrastructure that allows the city to pivot to a remote-work stance instantly, softening the blow of physical transit failure.
Meteorological Trends: Future Storm Intensity
This blizzard confirms a shift in the Northeast’s winter profile: fewer storms, but higher intensity. The atmospheric patterns driving these events are becoming more erratic, characterized by rapid pressure drops (bombogenesis). The fact that global weather patterns are showing similar volatility suggests that the NYC blizzard is a localized symptom of a broader atmospheric destabilization that will make “average” winters a thing of the past.
Behind the Scenes
The political dimension of this blizzard is the “Preemptive Shutdown.” Governors and mayors are now using States of Emergency as a legal shield to trigger insurance clauses and federal aid pathways earlier than ever before. Economically, this storm serves as a stress test for the “gig economy”—the thousands of delivery workers and independent contractors who face a total loss of income without the safety nets afforded to salaried corporate employees who can simply “work from home.”
Counter-Opinion: The Hyperbole Gap
There is a growing gap between “Blizzard Warnings” and “Blizzard Reality.” While some sectors saw 24 inches, the NYC area saw closer to 5 inches in many spots. The media’s tendency to lead with the highest possible metric (24 inches) creates a skewed perception of the storm’s actual impact on the average resident. This “worst-case scenario” reporting can lead to a “crying wolf” effect, where residents ignore future warnings that may actually be life-threatening.
Bold Prediction: Within the next six months, the NYC Department of Sanitation will announce a multi-million dollar investment in “Micro-Climate Modeling” technology. The city will move away from regional forecasts and toward block-by-block predictive analytics to prevent the kind of resource-allocation errors seen in this storm.
Frequently Asked Questions
How do snow totals in Central Park typically compare to the outer boroughs?
We often observe significant variations across the city, as coastal areas in Brooklyn and Queens may receive lower totals due to warmer sea air, while the Bronx frequently sees higher accumulations. While we use Central Park as the official benchmark, regional disruptions are often more severe in northern neighborhoods and inland areas.
What specific criteria must be met for a storm to be officially classified as a blizzard?
We classify a storm as a blizzard only when sustained winds or frequent gusts of 35 mph or higher occur alongside falling or blowing snow. These specific conditions must also reduce visibility to less than a quarter-mile for a duration of at least three consecutive hours.
How long does it usually take for the MTA to restore full service after a major blizzard?
We generally see underground subway service resume within hours of the storm’s end, but above-ground lines and commuter rails like the LIRR often require 24 to 48 hours for full restoration. We recommend monitoring real-time transit apps as crews must manually clear snow and ice from third rails and switches.
Which NYC neighborhoods are most at risk for flooding during the post-blizzard melt?
We find that low-lying coastal areas and neighborhoods with aging drainage systems are most susceptible to “slush flooding” as temperatures rise. We advise residents to clear snow away from catch basins and storm drains near their property to prevent localized street flooding and basement backups.
How does the city prioritize which streets are plowed first during a snow emergency?
We follow a tiered priority system where primary “Critical” routes, such as highways and streets with hospitals or emergency services, are cleared first. Once these are safe, we move to “Sector” streets and finally “Residential” side streets to ensure the most essential transit corridors remain open.
Conclusion
We believe that the recent blizzard highlights the critical need for robust urban infrastructure and proactive emergency management during extreme weather events. By analyzing the significant snow totals and regional disruptions, we conclude that while preparation was extensive, the severity of the storm underscores the ongoing challenges posed by intense winter weather in the metropolitan area.
References
- NBC New York — Live updates on blizzard conditions and snow totals across the NYC area.
- Ariana News — Coverage of the powerful blizzard sweeping across New York City and its impact.
- Daily Mirror — Report on the state of emergency declared in New York due to blizzard warnings.
- NextGen Knowledge — Details on New York City’s preparations for what officials called a severe snowstorm.
Report Inaccuracy
We value accuracy. If you find any inaccurate information, please let us know.